Where we live should not decide if we live or die *, but it does.
I have downloaded data from 241 countries and regions of the UN through the website ourworldindata.
Data on life expectancy from 1534 to 2015. The first centuries there is only information from England so I have limited the study to the period 1950 – 2015.
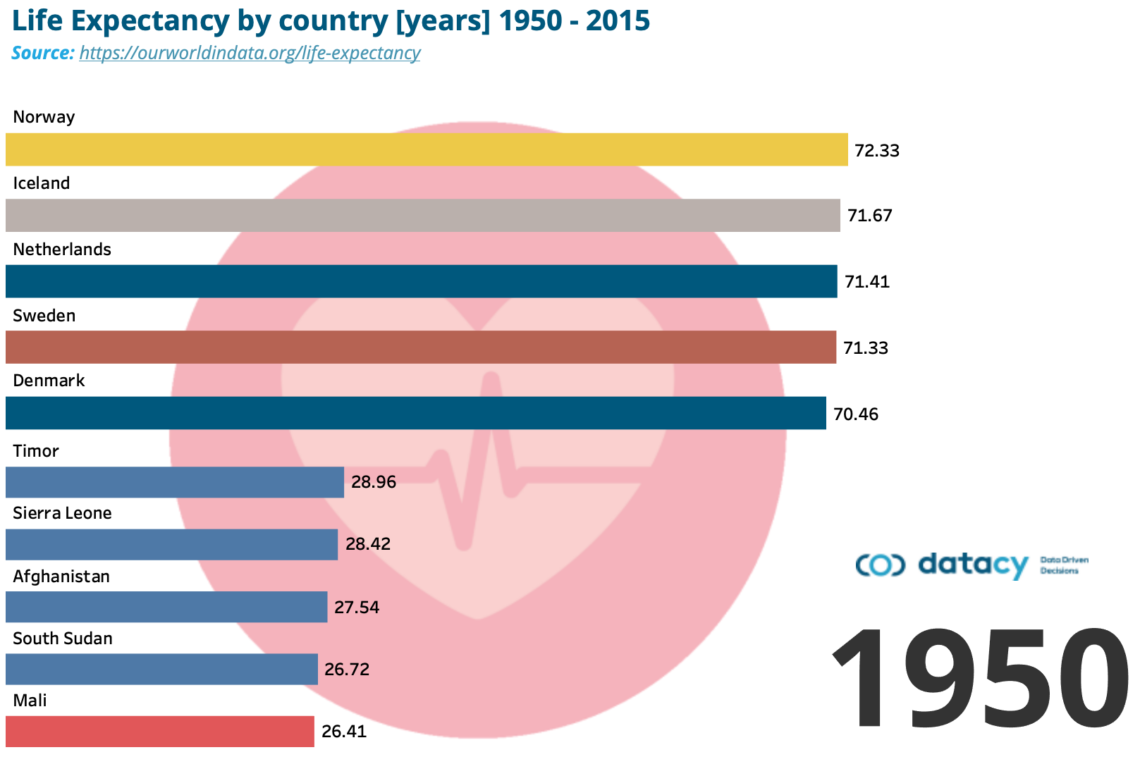
With this data I created a visualization in the form of an animated bar chart race.
Animated bar chart race.
The gap is decreasing
The country with the lowest life expectancy in 1950 was Mali with 26.42 years. 65 years later, the country with the lowest life expectancy is the Central African Republic with 51.41 years. A jump of 25 years.
The country with the highest life expectancy in 1950 was Norway with 72.35 years. 65 years later, the country with the highest life expectancy is Hong Kong with 83.80 years. A jump of 11.5 years.
The visualization includes the 5 countries with the highest life expectancy and the 5 countries with the lowest life expectancy between 1950 and 2015.
Some fight to get into the top group while others struggle to get out of the bottom one.
*verse from “Crumbs From your Table” – U2.

