(Social – Life expectancy)
Where we live should not decide if we live or die *, but it does.
I have downloaded data from 241 countries and regions of the UN through the website ourworldindata.
Data on life expectancy from 1534 to 2015. The first centuries there is only information from England so I have limited the study to the period 1950 – 2015.
With this data I have created a visualization in the form of an animated bar chart race. Today we go with the regions.
Animated bar chart race.
The gap is decreasing
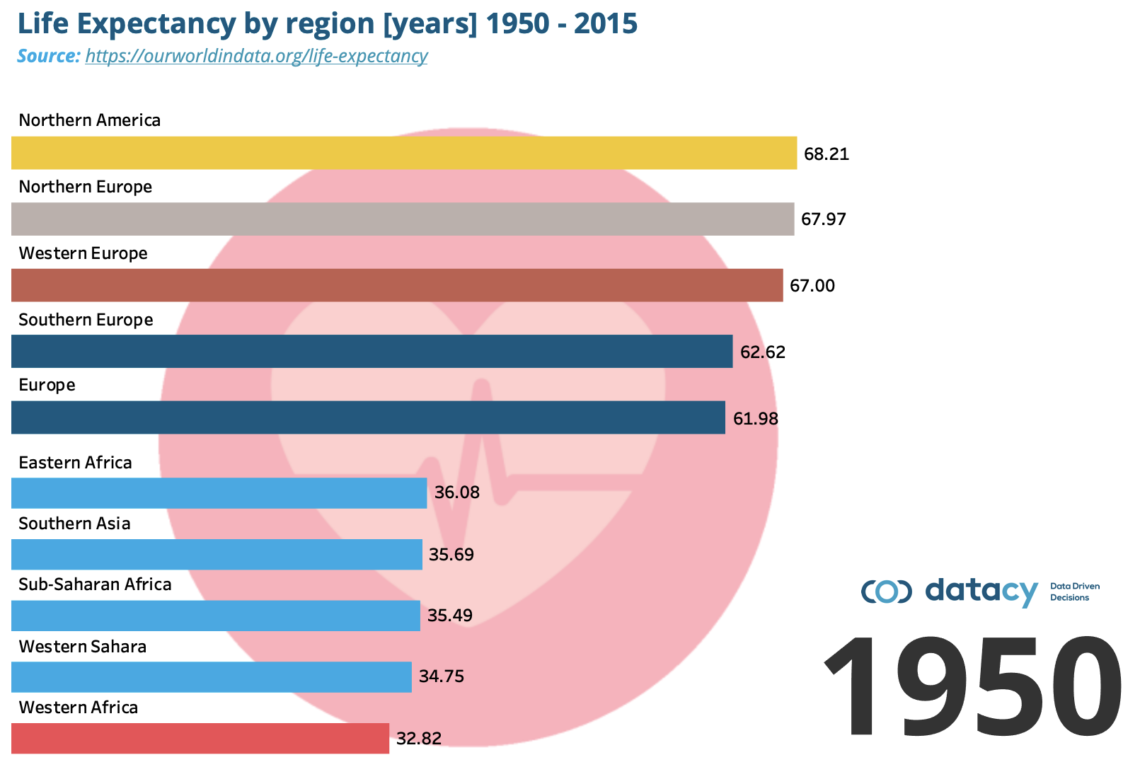
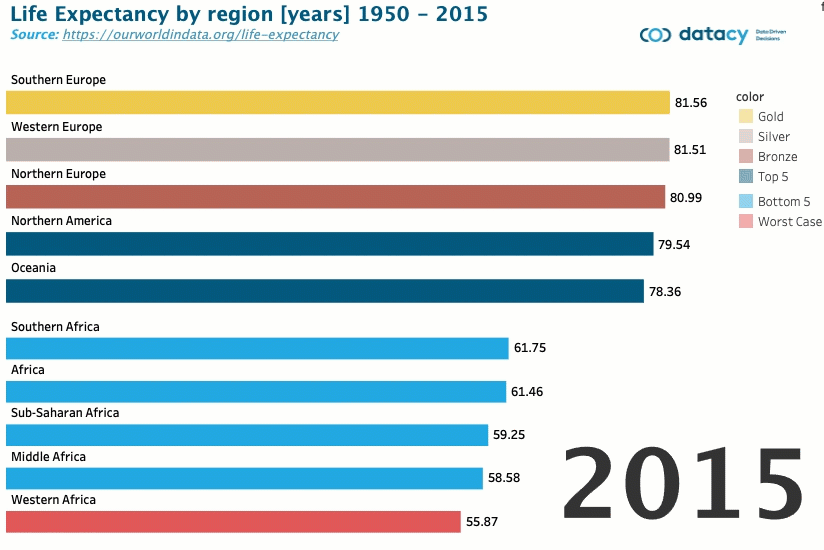
The region with the lowest life expectancy in 1950 was Western Africa with 32.82 years. 65 years later, the region with the lowest life expectancy remains Western Africa with 55.87 years. A jump of 23 years.
The region with the highest life expectancy in 1950 was Northern America with 68.21 years. 65 years later, the region with the highest life expectancy is Southern Europe with 81.56 years. A jump of 13 years.
The visualization includes the 5 regions with the highest life expectancy and the 5 regions with the lowest life expectancy between 1950 and 2015.
Those at the top grow by 20% while those at the bottom grow by 70%. A positive fact.
Some fight to get into the top group while others struggle to get out of the bottom one.
*verse from “Crumbs From your Table” – U2

