I dedicate a handful of hours a week to what I call “t + l – think and learn” and that could resemble what most companies call R & D or R + D + i.
It is a must to stay behind and more in a profession as linked to technology as mine.
It is a frustrating process in many occasions because things do not come to the first, nor to the second nor the third, … but it is part of learning.
And, above all, it is something enriching and rewarding because, when it comes out … the joy is immense.
Last weekend I was experimenting with D3.
D3.js (or simply D3 by the acronym of Data-Driven Documents is a JavaScript library to produce, from data, dynamic and interactive graphics in web browsers. It makes use of well-established technologies such as SVG, HTML5, and CSS.
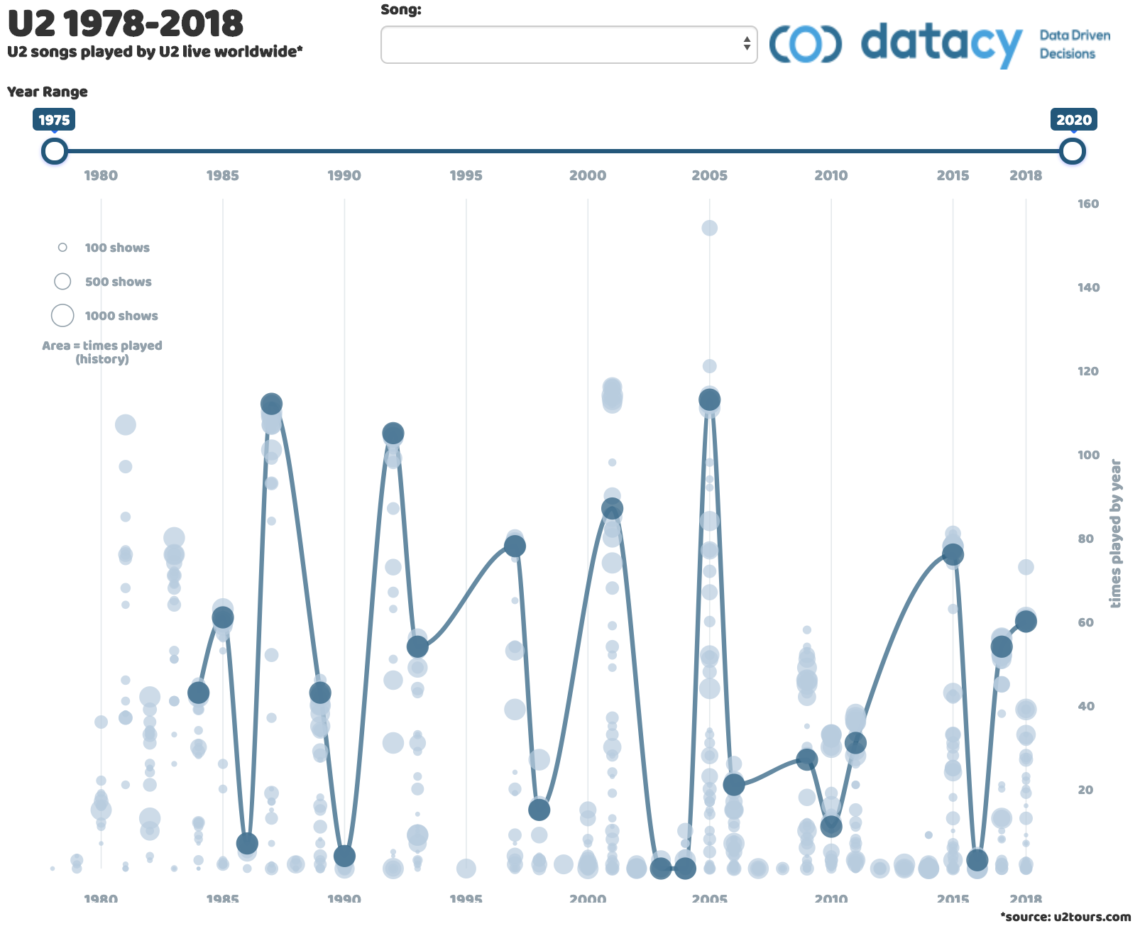
I have done a test to interactively visualize the evolution (number of performances in concerts) of U2 songs over the years.
I have processed the data in R and injected it directly to D3. It is not an excessively intuitive language but, with patience and dedication, it ends up coming out.
#r #rstudio #datacy #datadrivendecisions #javascript #d3 #d3js #datascience #bigdata #datascientist #mineriadedatos #u2 #u2shows #music #livemusic #u2ontour #visualizaciones #thepowerofdata #datamining


One Comment
Kill
Hi, I do believe this is an excellent blog.
I stumbledupon it 😉 I am going to come back once again since i
have bookmarked it. Money and freedom is the greatest way to change, may you be rich
and continue to help others. Wow, this article is pleasant,
my younger sister is analyzing these kinds of things,
so I am going to tell her. Hi there! Someone in my Facebook group shared this
website with us so I came to look it over. I’m
definitely loving the information. I’m bookmarking and will be tweeting this to my followers!
Terrific blog and excellent style and design. http://foxnews.net/